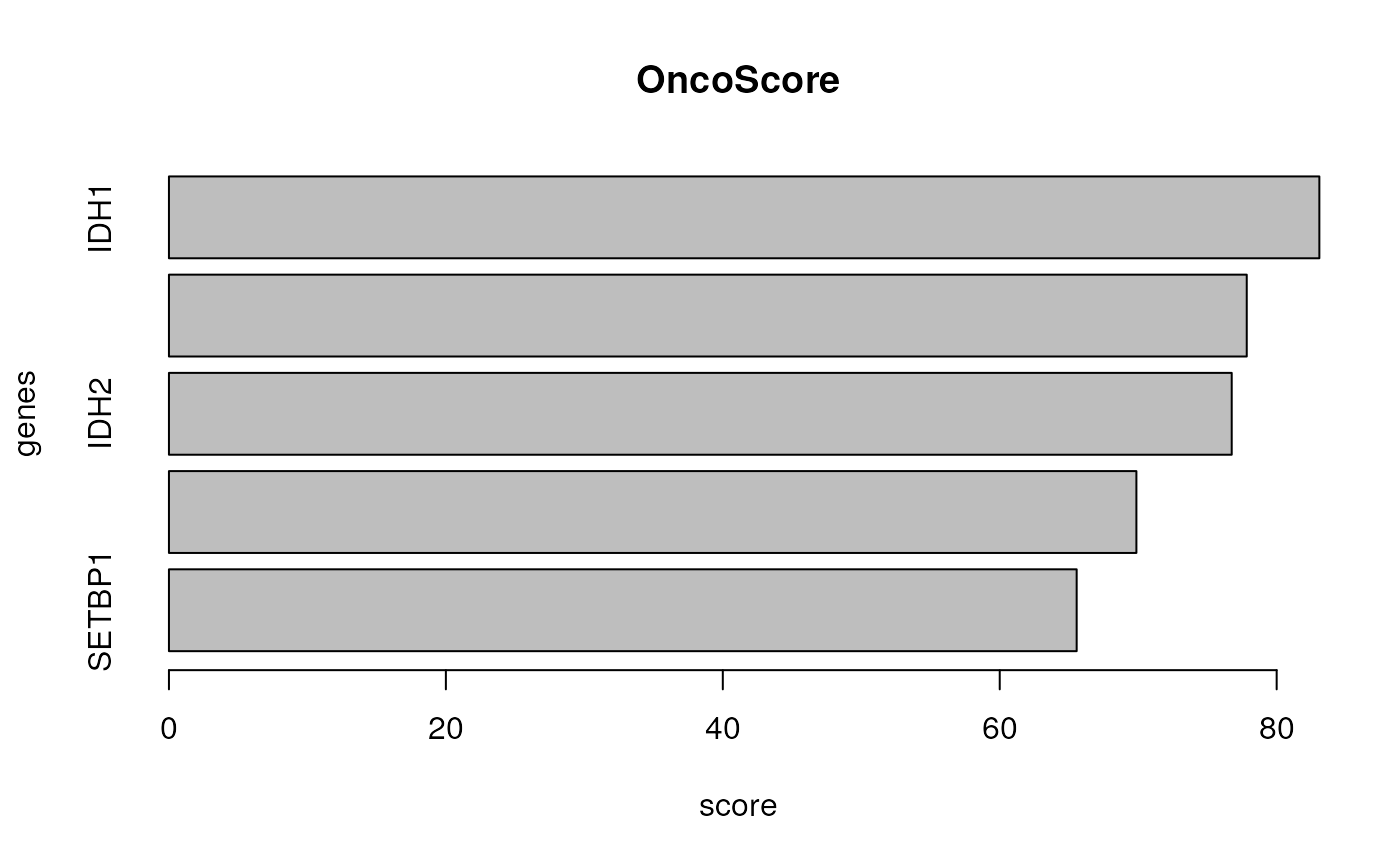
plot the OncoScore for a list of genes
# S3 method for class 'oncoscore'
plot(
  x,
  gene.number = 5,
  main = "OncoScore",
  xlab = "score",
  ylab = "genes",
  file = NA,
  ...
)
Arguments
Value
A plot
Examples
data(query)
result = compute.oncoscore(query)
#> ### Processing data
#> ### Computing frequencies scores
#> ### Estimating oncogenes
#> ### Results:
#> 	 ASXL1 -> 77.8392
#> 	 IDH1 -> 83.08351
#> 	 IDH2 -> 76.75356
#> 	 SETBP1 -> 65.556
#> 	 TET2 -> 69.86954
plot.oncoscore(result)
