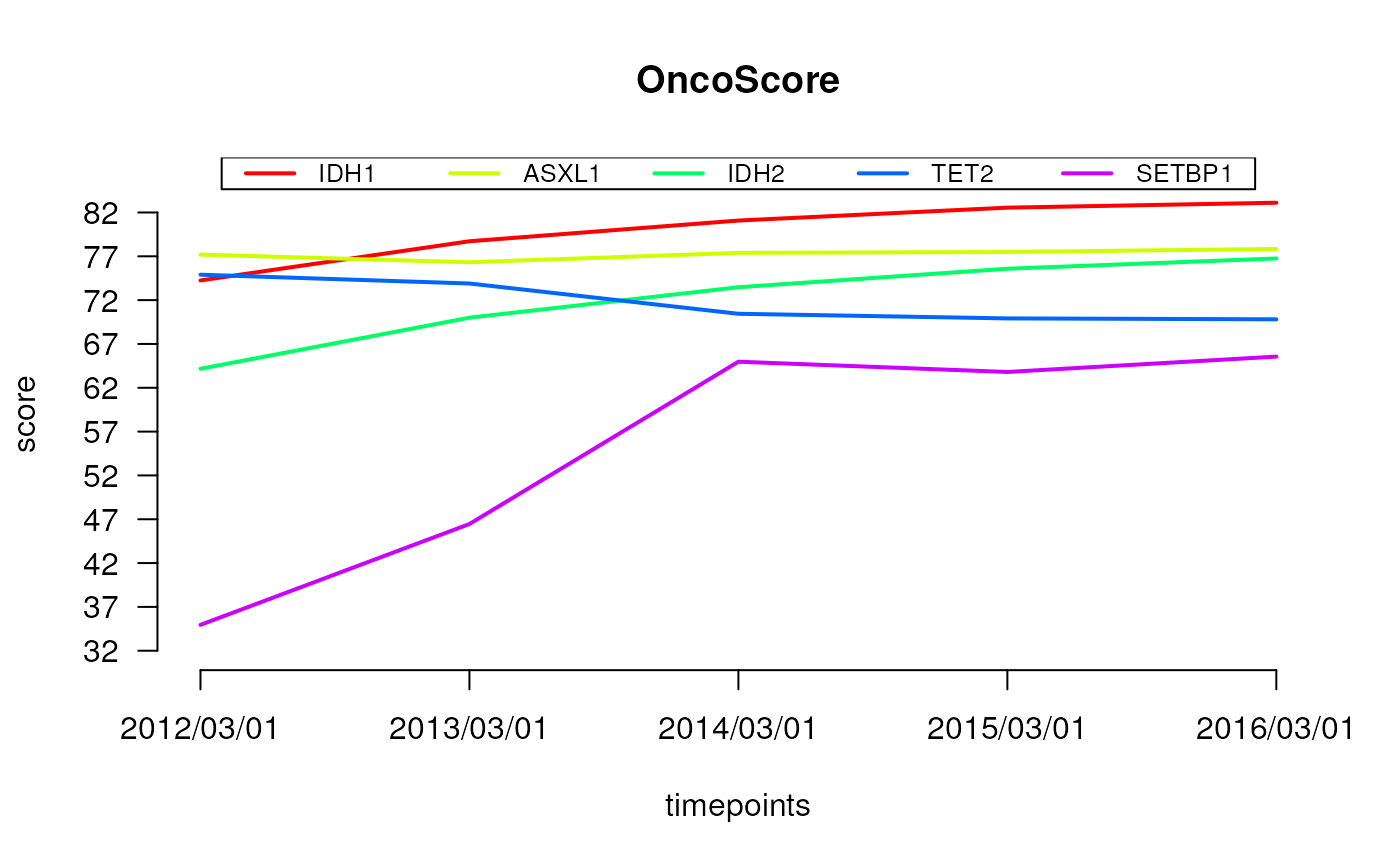
plot the OncoScore for a list of genes
# S3 method for class 'oncoscore.timeseries'
plot(
  x,
  gene.number = 5,
  incremental = FALSE,
  relative = FALSE,
  main = "OncoScore",
  xlab = "timepoints",
  ylab = "score",
  legend.pos = "top",
  file = NA,
  ...
)
Arguments
- x
input data as result of the function compute.OncoScore
- gene.number
number of genes to print
- incremental
display the OncoScore increment
- relative
dispaly the incrementa as relative value
- main
the title
- xlab
description of x asix (defaul score)
- ylab
description of y asix (defaul genes)
- legend.pos
Position of the legend
- file
where to save the plot
- ...
additional parameter to pass to the lines function
Value
A plot
Examples
data(query.timepoints)
result = compute.oncoscore.timeseries(query.timepoints)
#> ### Computing oncoscore for timepoint 2012/03/01
#> ### Processing data
#> ### Computing frequencies scores
#> ### Estimating oncogenes
#> ### Results:
#> 	 ASXL1 -> 77.19348
#> 	 IDH1 -> 74.24489
#> 	 IDH2 -> 64.1649
#> 	 SETBP1 -> 34.9485
#> 	 TET2 -> 74.90108
#> ### Computing oncoscore for timepoint 2013/03/01
#> ### Processing data
#> ### Computing frequencies scores
#> ### Estimating oncogenes
#> ### Results:
#> 	 ASXL1 -> 76.31902
#> 	 IDH1 -> 78.71551
#> 	 IDH2 -> 69.99559
#> 	 SETBP1 -> 46.4559
#> 	 TET2 -> 73.89695
#> ### Computing oncoscore for timepoint 2014/03/01
#> ### Processing data
#> ### Computing frequencies scores
#> ### Estimating oncogenes
#> ### Results:
#> 	 ASXL1 -> 77.39202
#> 	 IDH1 -> 81.07946
#> 	 IDH2 -> 73.46995
#> 	 SETBP1 -> 64.97398
#> 	 TET2 -> 70.44331
#> ### Computing oncoscore for timepoint 2015/03/01
#> ### Processing data
#> ### Computing frequencies scores
#> ### Estimating oncogenes
#> ### Results:
#> 	 ASXL1 -> 77.49295
#> 	 IDH1 -> 82.55032
#> 	 IDH2 -> 75.58179
#> 	 SETBP1 -> 63.80208
#> 	 TET2 -> 69.91466
#> ### Computing oncoscore for timepoint 2016/03/01
#> ### Processing data
#> ### Computing frequencies scores
#> ### Estimating oncogenes
#> ### Results:
#> 	 ASXL1 -> 77.8392
#> 	 IDH1 -> 83.11346
#> 	 IDH2 -> 76.75356
#> 	 SETBP1 -> 65.556
#> 	 TET2 -> 69.81125
plot.oncoscore.timeseries(result)
