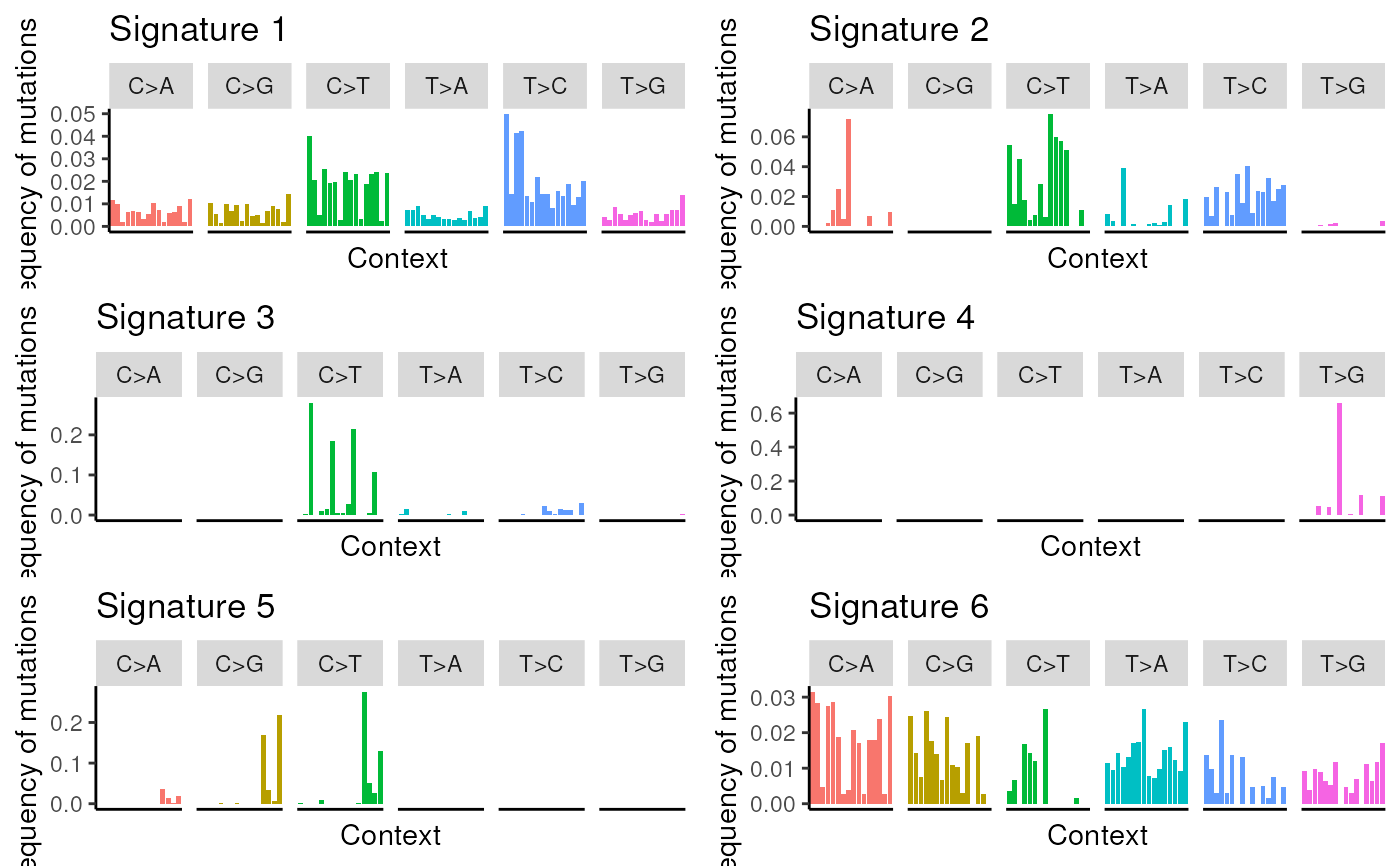
Plot the inferred mutational signatures.
signatures.plot(beta, useRowNames = FALSE, xlabels = FALSE)Arguments
Value
A ggplot2 object.
Examples
data(nmf_LassoK_example)
signatures.plot(beta=nmf_LassoK_example$beta)
Plot the inferred mutational signatures.
signatures.plot(beta, useRowNames = FALSE, xlabels = FALSE)A ggplot2 object.
data(nmf_LassoK_example)
signatures.plot(beta=nmf_LassoK_example$beta)